We compare the "next-day" ARMA prediction results and
a simple Random Walk (RW) model. In RW model the next day value is
![]() and the predicted value is equal to the conditional expectation of
and the predicted value is equal to the conditional expectation of ![]() . This means that the present value is the RW prediction for the next day.
. This means that the present value is the RW prediction for the next day.
There are two reasons to consider RW models
| $/ |
- 1.779090e-01 | 1.293609e+00 | 8.454827e-02 |
| DM/$ | - 1.191e-02 | 1.092e-01 | 9.985e-02 |
| Yen/$ | - 1.086e+00 | 6.369e+00 | 6.446505e+00 |
| Fr/$ | - 3.029e-01 | 4.285e-01 | 3.395e-01 |
| AT&T | -1.375e+00 | 4.554e+00 | 3.621e+00 |
| Intel Co | +2.814e-01 | 2.052e+01 | 1.936e+00 |
| Hermis Bank | -4.280e+01 | 2.374e+01 | 1.998e+01 |
| London Stock Exchange | -5.107e-01 | 2.751e+02 | 2.346e+01 |
| Call Center | +3.076e+01 | 8.453e+02 | 7.111e+02 |
The data was divided into three equal parts.
The first part was applied to estimate parameters ![]() and
and ![]() of an ARMA model using different parameters
of an ARMA model using different parameters ![]() and
and ![]() .
.
The best values of ![]() and
and ![]() were defined using the
second part of data.
were defined using the
second part of data.
The third part was used to compare ARMA and RW models. The table shows the comparison results.
Table 1.1 demonstrates that the ARMA model predicts all the financial data not better than RW. However ARMA predicts call rates 31 percent better then RW. That is a statistically significant difference. The observed deviations between RW and ARMA models predicting financial data are to small for practical conclusions.
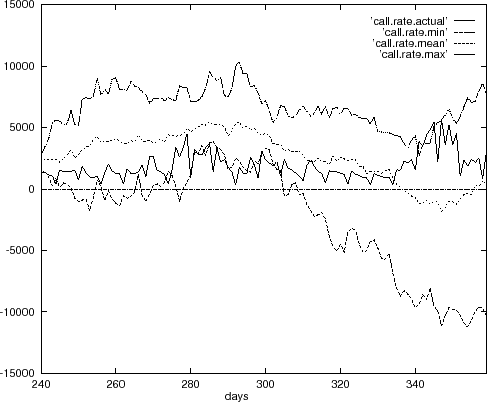
Figure 1.1 shows optimal parametersThe "multi-day" predictions of call rates are shown in Figure 1.2.
![\begin{figure}\begin{codebox}{4.7in}
\begin{verbatim}b[0] = -2.888616e-01
a[...
...] = -1.432491e+03
a[11] = 8.030343e-01\end{verbatim}
\end{codebox}
\end{figure}](img79.png)