


Next: ANN Software
Up: Multi-Factor ARMA Software
Previous: Illustrative Example of ARMA
To illustrate the software application
the second example using the simplest test file will be described. The test file is defined by the file 'test.ini':
INP test2
COL 1
COL 2
Here INP defines the data file 'test2':
1.   1.
2.   1.
1.   1.
2.   1.
1.   1.
2.   1.
1.   1.
2.   1.
1.   1.
where COL 1
means that the first column of the file 'test2' should be considered as the factor to be predicted and COL
2 indicates the second column as another factor.
A fragment of the optimization results is
shown in the Figure 1.29 .
Figure 1.29:
A fragment of the control parameters and optimization results of the simplest illustration
 |
Here 'delta_perc' denotes the error in percents
of the "Random Walk"prediction
and 'delta_mean' is just the average error.
The results of optimizations are printed as 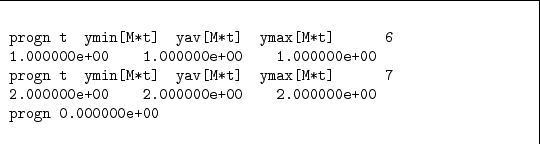 .
The prognoses results are in the file 'progn.out.old' (see Figure 1.30)
.
The prognoses results are in the file 'progn.out.old' (see Figure 1.30)
Figure 1.30:
Example of the prediction results of the simplest illustration
![\begin{figure}\begin{codebox}{4.7in}
\begin{verbatim}progn t ymin[M*t] yav[M*t...
...000e+00 2.000000e+00
progn 0.000000e+00\end{verbatim}
\end{codebox}
\end{figure}](img295.png) |
Here the minimal  the average
  and the maximal
  prognoses values are the same because the prognoses variance
  is zero.
Next: ANN Software
Up: Multi-Factor ARMA Software
Previous: Illustrative Example of ARMA
mockus
2008-06-21